What the Heck Is Mikel Arteta Talking About?
The Arsenal manager recently rolled out a bunch of fancy percentages about his team's recent results. Progress? Or a poor portrayal of their performances?
Before we begin: The No Grass in the Clouds sale is still ongoing! If you sign up by December 25, you’ll get 30 percent off a monthly or an annual subscription, which includes access to the weekly Friday newsletter and a number of other perks. Sound good? Click this button:
OK, let’s get to it.
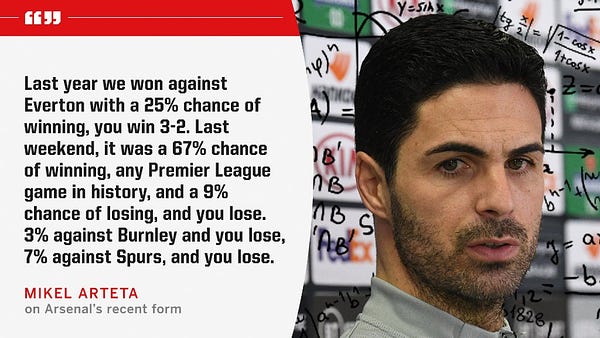
Mikel Arteta is at it again. First, it was the monologue about crossing. Pure maths and all that. Then, on Monday, he rolled out this one:
Yeah, so, uh ... what? Is he right? Is he wrong? Is he misinterpreting the information once again? Well, it’s a little bit of everything.
We’ll start with the first one: “Last weekend, it was a 67 percent chance of winning, any Premier League game in history, and a 9 percent chance of losing, and you lose.” Presumably he’s referring to the Everton match, which Arsenal lost, 2-1. And presumably he’s using some kind of model that spits out a team’s chances of winning a game based on some kind of expected value that uses “any game in Premier League history” for comparison. It’s almost definitely not “any game in Premier League history” because the data doesn’t go back that far, but let’s assume that “any game in the dataset” is what Arteta actually means.
Maybe the model just uses expected goals. Per the site Understat, Arsenal created 1.25 expected goals and allowed 0.66. Based on that, the Understat model says that Arsenal would win this game 55 percent of the time, draw it 30 percent of the time, and lose 15 percent of the time. That’s not quite what Arteta said, but it’s close enough. Understat is an anonymous website without a publicly published methodology behind their model, so presumably Arsenal, who employ a number of high-profile analysts, would have a more finely tuned, more accurate algorithm.
They also might be using more data than just shots. Expected possession values are the next step beyond xG -- summing up the goal probability that every event has on a team’s scoring probability, rather than just the value of the shots themselves. Liverpool openly talk about using one, and Arsenal’s Sarah Rudd gave a public presentation on the topic nearly a decade ago, so it seems safe to assume that Arsenal have some kind of in-house EPV model, too.
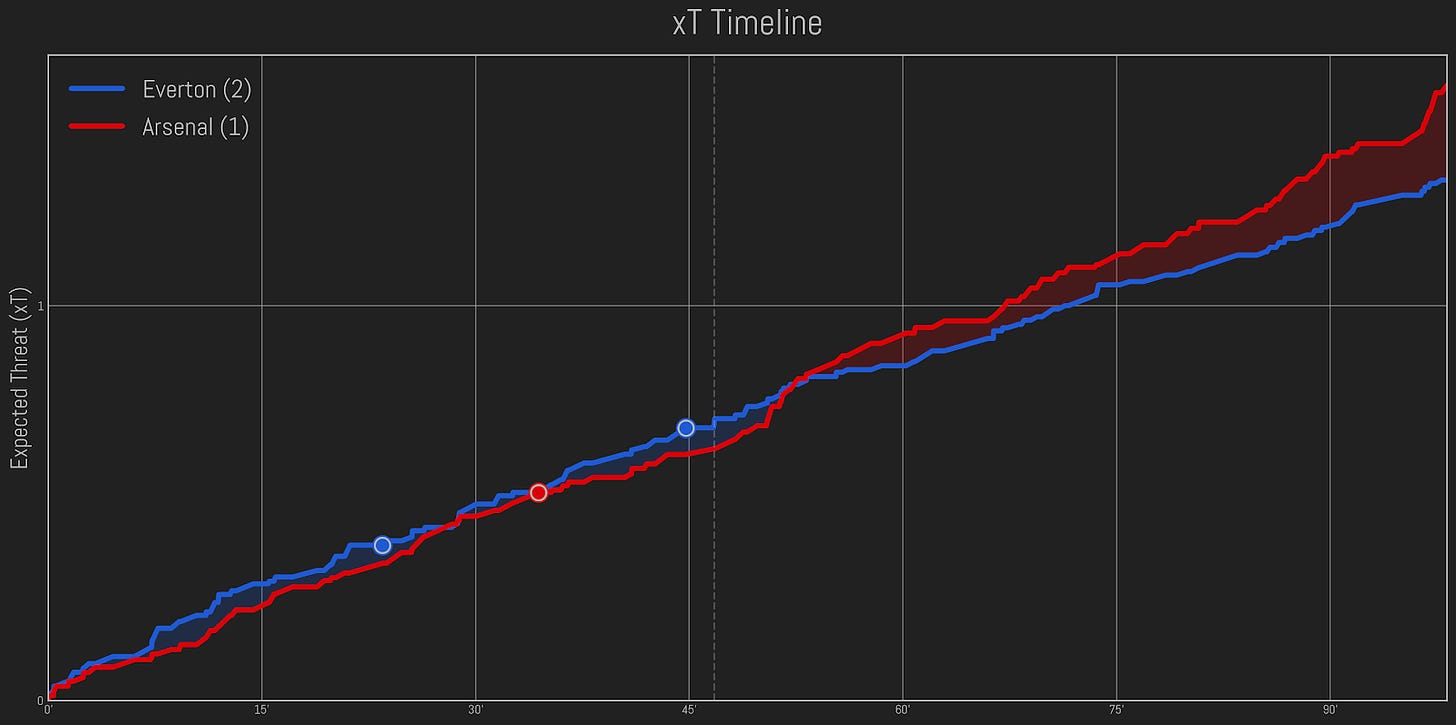
The most-intuitive of these models I’ve seen is Expected Threat (xT), which was built by a software engineer named Karun Singh. As he described it to me, “Given the ball at a certain location on the pitch, xT tells us the chances of a team going on to score in that possession." And so, the teams that move the ball into more dangerous areas and keep it there will tend to generate the most xT. Here’s the cumulative xT chart for the Everton match, with goals represented by colored dots:
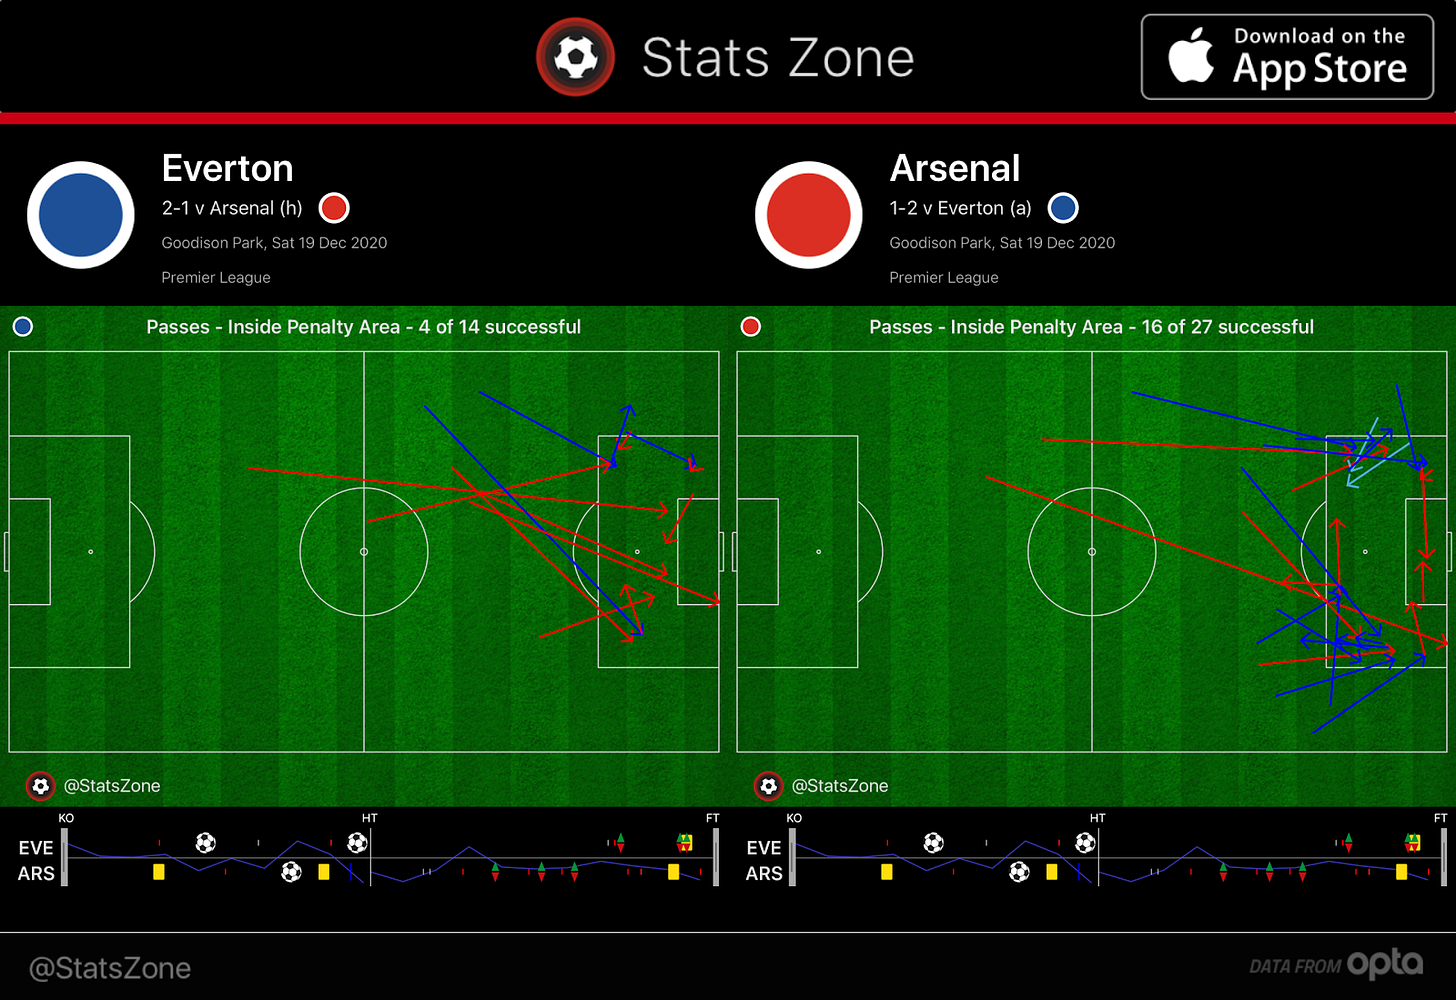
Some more basic metrics help show this, too. Arsenal completed more than two thirds of the game’s final-third passes:
And if you wanted to create your own your-brain-based EPV model, you could do a lot worse than just keeping a running tally of how often a team moves the ball into the penalty area as you watch a given match. After creating a chance or getting in position to take the chance, the most valuable thing an individual player can do, on aggregate, is to move the ball into the penalty area. Arsenal did that against Everton, too.
Based on all of that, it’s not inconceivable that an EPV model would rate their performance even higher than one that only included shots. FiveThirtyEight has a non-shot xG model, which they define as the following. (Apologies to premium subscribers for re-cooking this definition two issues in a row.)
Non-shot expected goals are an estimate of how many goals a team “should” have scored based on non-shooting actions they took around the opposing team’s goal: passes, interceptions, take-ons and tackles. For example, we know that intercepting the ball at the opposing team’s penalty spot results in a goal about 9 percent of the time, and a completed pass that is received at the center of the six-yard box leads to a goal about 14 percent of the time. We add these individual actions up across an entire match to arrive at a team’s non-shot expected goals. Just as for shot-based expected goals, there is an adjustment for each action based on the success rates of the player or players taking the action (both the passer and the receiver, in the case of a pass).
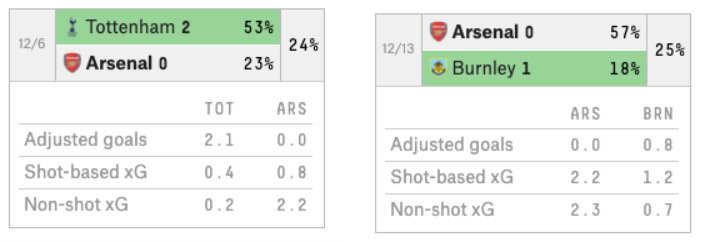
For the Everton match, their shot-based and non-shot-based xG totals for the match don’t differ too much from each other, but the non-shot number is still slightly more in Arsenal’s favor than the Understat data mentioned earlier: 1.5 to 0.7. Per Understat, Arsenal’s loss probability in the Burnley match was 13 percent and 20 percent against Spurs. In both of those matches, Arsenal’s non-shot xG margins were significantly better than their shot-based margins. Per FiveThirtyEight:
I still don’t feel like that’s a big enough gap to get to the super-low loss probabilities that Arteta is citing, but I think we now have a decent idea of what’s going on here. After talking to some people that work within the game, my guess is that Arteta gets some kind of stats print-out after matches and it includes readings from an expected-value model that says how often, “in Premier League history”, a team that produces and concedes those values can be expected to win, lose, or draw that match.
In one sense: wow! A manager at one of the biggest clubs in the world is citing probabilities built on black-box-type algorithms that Proper Football Men still scoff at. This seems like a big deal! Except, well, it also seems like Arteta is cherry-picking beneficial nuggets of info and stripping out all of the context.
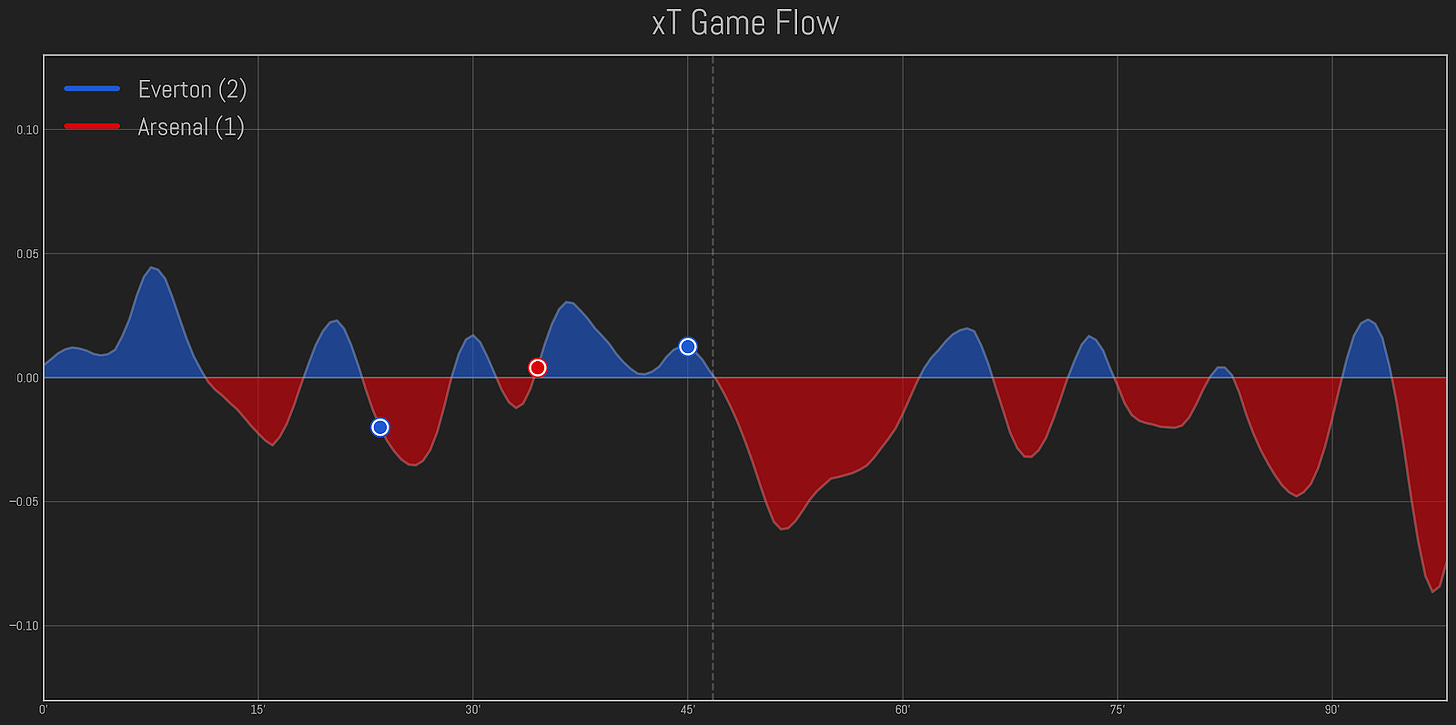
“One could very well argue that Arsenal's sustained second half xT dominance is because of Everton's approach to the game state,” Singh told me. “Similarly, if Arsenal equalized right after the break, we may have seen Everton hit back as they did at 1-1. This is essentially why I've strayed away from turning xT into a simple expected scoreline/result — any method one uses will always suffer from this hypothetical ‘if they scored here, how would the rest of the game have gone differently?’ problem.”
Instead, Singh prefers to present his game-by-game charts like this one, which better represents the different pockets of play and clearly shows how the teams responded to changes in the scoreline:
Whether or not it’s optimal, teams do play differently after scoring a goal. They tend to sit back in more of a shell and allow a higher number of chances (albeit typically of a lower quality) than they do when the match is tied. If you’ve watched soccer, you know this happens, and you can also probably understand how such a thing would skew all these numbers we’ve already cited.
“One could theoretically have very dominant xT by passing around the opponent's box the whole game without taking any shots,” Singh said. “I do think this one is very relevant to Arsenal at the moment. If I remember correctly, against Everton, their only ‘good’ chance outside of the penalty was Bukayo Saka's chance right at the death.”
While Arsenal, on the whole, created the better chances in all three of the matches Arteta cited, they were actually slightly worse when the game was tied and these shot-skewing incentives weren’t pulling at either side’s performance. Per Stats Perform, Arsenal conceded 1.46 xG to the 1.44 they created when the score was tied in these matches. Now, they also conceded four goals and scored none in the even game state, so they’ve absolutely been unfortunate in that regard, but that bad luck also likely played a role in producing the overwhelming win-probabilities that Arteta has been citing in his team’s favor.
Now, perhaps Arteta just doesn’t understand the information he’s being given. For all the data we have about the game now, most analysts at big clubs still work on the fringes, answering requests and producing reports that don’t fundamentally affect how the team plays every weekend. Liverpool, with data-fluent people at the center of their decision-making process, are not the norm. But even if soccer’s versions of Billy Beane and Daryl Morey are still a long way away from gaining any real power, there’s still a clear place at every club for someone to serve as a translator. In baseball, they’re often called “conduits”: former players employed by the front office who can speak fluently about numbers in a way coaches and players can understand. This isn’t something they do in addition to a bunch of other responsibilities; no, their job is to translate abstract info to the people who would benefit from it most.
“A data scientist is only as good as their ability to communicate results,” Sam Goldberg, a former minor league baseball player who has worked for the Chicago Cubs and DC United, told me. “As data gets more infused into the fabric of professional soccer teams, we are most likely going to see hires that can have a kick about as well as build a mathematical model. These roles already exist in other professional sports and soccer will trend that way in some time.”
Of course, Arteta didn’t only misunderstand the model. One other thing you might notice is that he conveniently left out the Southampton match at home, from less than a week ago, when Arsenal got out-played to a significant degree by any readily available metric and yet still eked out a draw. Same goes for the Leeds match in November, or the West Ham game in September, or the two wins over Liverpool, or the victory over Manchester City in the FA Cup semifinal ... and now you can see where I’m going.
Over time, these things tend to come close to canceling each other out. Using those win-probability numbers, Understat produces a metric called “expected points”. I don’t love it -- see: the previous four paragraphs -- but it’s in keeping with the framework Arteta is applying to assess his team. Based on this number, we would expect Arsenal to have 18.84 points at this stage of the season. That’s certainly more than the 14 points they’ve won so far, but not some kind of season-saving skew, either. By expected points, they should be in 11th place, rather than 15th -- slightly better than where they are, and nowhere near where the coach and the club had hoped to be.
Arsenal have been somewhat unlucky this season, but that’s not really Arteta’s biggest issue. No, his main problem is that his team just isn’t very good.


